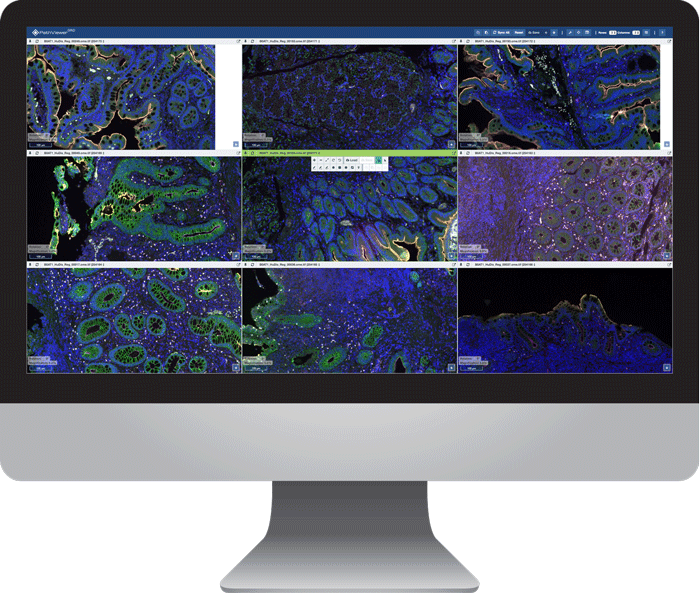
See PathViewer and PathViewer GRID in action at our latest webinar:

Data and results shown here are in whole or part based upon data from Atlas of Intestinal Support
[Prof Jerrold R. Turner Lab; Brigham and Women’s Hospital, Harvard Medical School]
Built for You: the Researcher and Pathologist
As the digital pathology imaging field advances, data management solutions need to keep pace. At Glencoe, we are constantly searching for ways to innovate and improve our products. We talk to customers, listen to feedback, and survey the marketplace.
The result is PathViewer: an interactive visualization, analysis and annotation tool specifically tailored for digital pathology, and the most powerful, easy to use pathology WSI data viewing and annotation tool available.
A Faster and Easier Way to Work with Multi-image and Multiplexed Workflows
If you’re looking for an easier way to streamline your workflow for Digital Pathology, look no further. Our data management solution is better than ever with powerful new features:
Advanced grid capabilities
Compare across modalities or serial sections and save inter-slide registration. Propagate annotations across multiple slides.
GRID views for multiplexing
Compare single channels or channel groups side-by-side for streamlined review of multiplexed data.
More control
Augment your slide review workflows by creating, saving and sharing GRID Views with your colleagues. Hide GRID controls to extend the slide’s visible area. Navigate between GRID Pages with the new keyboard shortcuts.
Explore images and analytics in one view
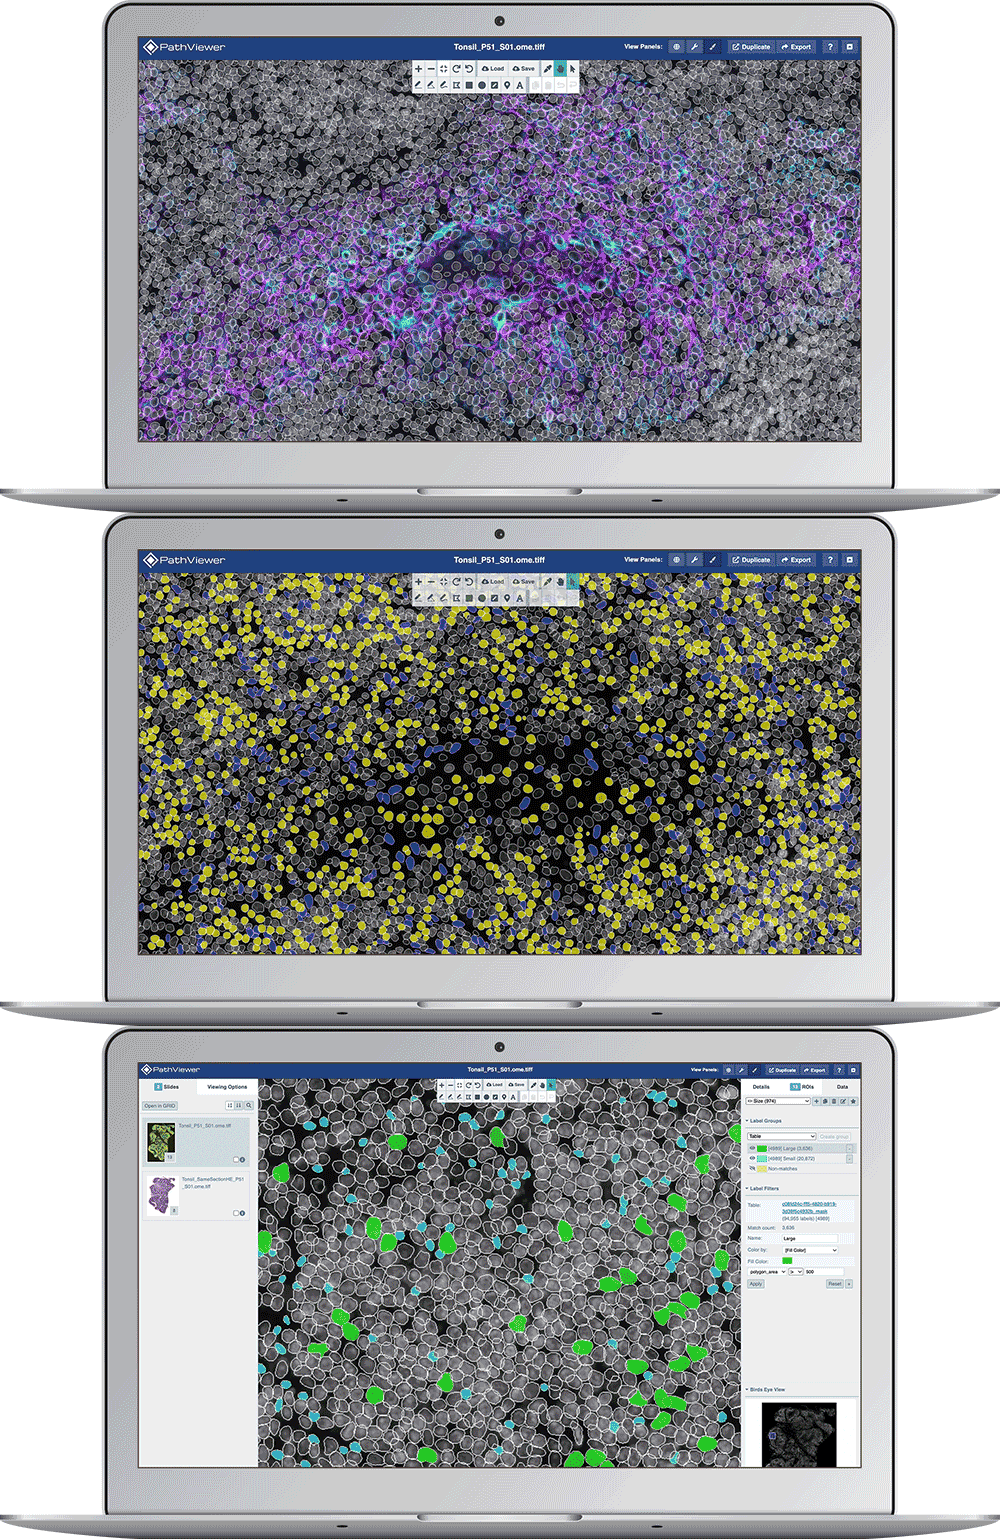
Evaluate analytical results in the same intuitive interface used for viewing and annotating images - all within the browser. Designed for the computational pathologist, see the latest features for analytical data in PathViewer:

Data and results shown here are in whole or part based upon data from RareCyte acquired on their Orion instrument.
Controlled visibility
Control the transparency, color, and visibility of image segmentation and classification overlays.
Interoperability
Results come from your analysis platform of choice, and multiple results can be compared.
Visual data mining
Filter and highlight objects of interest based on your custom measurements and classifications.

